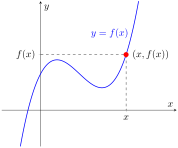
One way to visualize a function is by graphing it. The graph of a function \(y=f(x)\) is the set of all ordered pairs or points \((x,f(x))\) in the \(xy\)-plane such that \(x\) is in the domain of the function \(f\) and \(y=f(x)\) is the output assigned to the input \(x\) by \(f\text{.}\)
This graph is often a curve in the \(xy\)-plane. Specifically, it is the set of all ordered pairs \((x,f(x))\) for which the second coordinate \(y\) is the value of the function \(f\) at the first coordinate \(x\text{;}\) that is, the graph is the set of all points \((x,y)\) that satisfy the equation \(y=f(x)\text{:}\)
It is not always reasonable or even possible to plot the ordered pair associated with each \(x\) in the domain of a given function \(f(x)\text{.}\) This is because functions can have many (sometimes even infinitely many) possible inputs. When drawing the graph of a function by hand, we customarily take relatively few points \(x\text{,}\) plot the corresponding ordered pairs \((x,f(x))\) in the \(xy\)-plane, and then join neighboring ordered pairs with straight line segments. The result is an approximation of the graph of the function. Graphing calculators and other graphing tools do exactly this—they just use a greater number of inputs \(x\) than we typically would when graphing by hand.
The graph of a function \(y=f(x)\) is the collection of all points \((x,y)\) in the \(xy\)-plane for which \(y=f(x)\text{.}\) In other words, the graph is the collection of points \((x,f(x))\) for all inputs \(x\) in the domain of \(f\text{.}\)
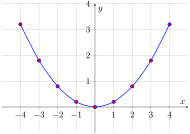
The below table gives each input \(x\text{,}\) the corresponding output \(y\) obtained by calculating \(f(x)\text{,}\) and then the associated point \((x,f(x))\text{.}\)
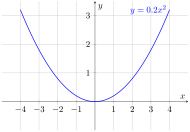
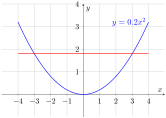
Plotting these points on the \(xy\)-plane and joining neighboring points by straight line segments results in the following rough sketch of \(f(x)=0.2x^{2}\text{:}\)
This is a decent approximation of the graph of \(y=0.2x^{2}\text{.}\) A better graph of \(y=0.2x^{2}\) can be obtained from a graphing calculator, graphing software package, or other similar tool.
Sometimes, a function is given graphically. That is, we are given only the graph of the function. The following examples illustrate that a great deal of information can be extracted from the graph of a function.
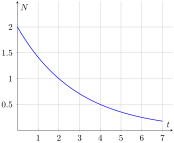
The amount of nicotine in a person’s bloodstream, \(N=f(t)\text{,}\) in milligrams, is a function of the time \(t\text{,}\) in hours, that has passed since the person smoked a single cigarette. The graph of the function \(f(t)\) is given in Figure 1.2.5.
Note that \(f(0)=2\) (as the point \((0,2)\) belongs to the graph of \(f(t)\)). Thus, at \(0\) hours—so immediately after a person finishes smoking a cigarette—the amount of nicotine in their bloodstream is \(2\) milligrams. This is the amount absorbed from the cigarette.
As time goes on, the amount of nicotine decreases. We see from the grid on the \(tN\)-plane that \(f(2)=1\text{;}\) in other words, the point \((2,1)\) lies on the graph. This tells us that \(2\) hours after smoking a single cigarette there is \(1\) milligram of nicotine left in the bloodstream.
Similarly, we observe that \(f(4)=0.5\) and conclude that \(4\) hours after smoking a single cigarette there is only \(0.5\) milligram of nicotine left in the bloodstream.
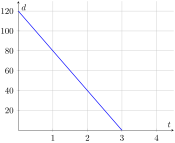
A woman is driving to visit with her family in a town \(120\) miles from her home. Let \(t\) be the time, in hours, since she left her home. Let \(d\) be the distance, in miles, to her destination. Here, \(d\) is a function of \(t\text{:}\)\(d=g(t)\text{.}\) The graph of the function \(g(t)\) is given in Figure 1.2.7.
The point on the graph above \(t=1\) is \((1,80)\text{.}\) In function notation, this can be written as \(g(1)=80\text{.}\) The practical meaning of this notation is that the distance to her destination after \(1\) hour of driving is \(80\) miles.
We look for the point on the graph for which the second coordinate is \(d=60\text{.}\) The \(t\)-coordinate of that point seems to be at \(t=1.5\text{.}\) We conclude that the point \((1.5,60)\) lies on the graph, and that the associated function notation is \(g(1.5)=60\text{.}\) This means that after \(1.5\) hours, the woman is 60 miles from her destination.
The woman reaches her destination when \(d=0\text{;}\) that is, when \(g(t)=0\text{.}\) From the graph, it is clear that \(g(3)=0\text{.}\) Hence the woman arrives at her destination after \(3\) hours.
In the first hour of driving, her distance from her destination drops from \(120\) miles to \(80\) miles. After the next hour, it drops from \(80\) miles to \(40\) miles, and then from \(40\) miles to \(0\) miles during the hour after that. This pattern reveals that the woman is traveling at \(40\) miles per hour.
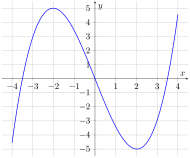
The function \(N=f(t)\) in Example 1.2.3 is decreasing—its graph is falling as \(t\) increases. The amount of nicotine decreases as the amount of time after smoking a cigarette increases. In Example 1.2.6 the distance to the destination \(d=g(t)\) decreases as the time \(t\) spent driving increases. The function in Example 1.2.3 is neither increasing nor decreasing in its domain. At first, over the negative \(x\)-axis the graph is falling; the values \(f(x)\) decrease as \(x\) increases. Then, over the positive \(x\)-axis, the graph is climbing; the values \(f(x)\) increase as \(x\) increases. We can say that \(f\) is decreasing on the interval \(x \lt 0\) and increasing on the interval \(x \gt 0\text{.}\)
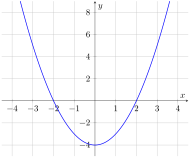
The graph of \(f(x)\) is climbing on the interval \(-4 \lt x \lt -2\) and on the interval \(2 \lt x \lt 4\text{.}\) Hence, the function is increasing on these intervals. In interval notation, we would write that the function is increasing on \((-4,-2)\cup(2,4)\text{.}\)
The graph of \(f(x)\) is falling and thus \(f(x)\) is decreasing on the interval \(-2 \lt x \lt 2\text{.}\) In interval notation, we would write that the function is decreasing on \((-2,4)\text{.}\)
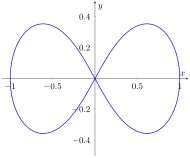
We have established that the graph of a function \(y=f(x)\) is often a curve in the \(xy\)-plane. However, not every curve in the \(xy\)-plane is the graph of a function. The definition of a function requires that for each input \(x\) in the domain there is exactly one output \(y\text{.}\) That is, there cannot be two different outputs corresponding to the same input.
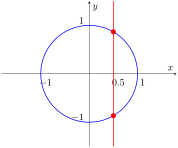
Let a curve in the \(xy\)-plane be given. If there is a vertical line that intersects the curve more than once, then the curve does not represent a function. If every vertical line intersects the curve at most once, then the curve represents the graph of a function.
This vertical line intersects the circle at two points with two different values of \(y\text{,}\) meaning there are two outputs corresponding to the input \(x=0.5\text{.}\) This violates the definition of a function. Hence, the circle is NOT the graph of a function.
In utilizing the Vertical Line Test, it doesn’t matter if the coordinates on the plane are labeled with \(x\text{,}\)\(y\text{,}\) or other letters. The idea is the same.
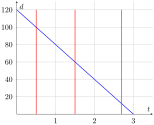
The line segment is the graph of a function whose domain is the interval \(0\leq t\leq3\text{.}\) Using the Vertical Line Test, we can see that each individual vertical line that passes through a specific value of \(t\) with \(0\leq t\leq 3\) on the horizontal axis crosses the line segment at exactly one point. Any vertical line that passes through a value of \(t\) outside the interval \(0\leq t \leq 3\) does not intersect the segment.
Note that, in general, a function can have the same output for two different inputs. In Example 1.2.3, the function \(f(x)=0.2x^{2}\) gives the same output \(y=1.8\) for both \(x=3\) and \(x=-3\text{.}\) Still, for each \(x\text{,}\) we have only one value of \(y\text{.}\)
Having the same output for two different inputs means that some horizontal lines intersect the graph more than once which is perfectly fine for a function:
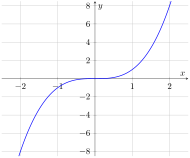
Create a table of values and sketch the graph of the function \(y=x^3\) for \(-2\leq x\leq 2\text{.}\) Then use a graphing calculator or other graphing utility to check your graph.
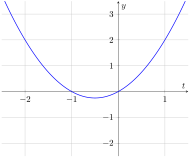
Create a table of values and sketch the graph of the function \(f(t)=t^2+t\) for \(-2\leq t\leq 1\text{.}\) Then use your calculator or any other graphing utility to check your graph.
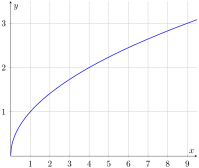
Create a table of values and sketch the graph of the function \(g(x)=\sqrt{x}\) for \(x\geq 0\text{.}\) Then use a graphing calculator or other graphing utility to check your graph.
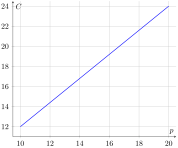
The total cost of a meal in a restaurant, \(C\text{,}\) in dollars, as a function of the price of the meal, \(p\text{,}\) in dollars is given by:
\begin{equation*}
C=p+0.20p
\end{equation*}
where the term \(0.20p\) corresponds to the \(20\%\) tip. Create a table of values and sketch the graph of the function \(C=p+0.20p\) for \(10\leq p\leq 20\text{.}\) Then use your calculator or any other graphing utility to check your graph.
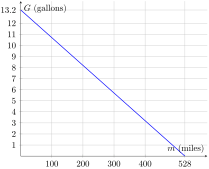
A driver of a 2019 Toyota Corolla fills his gas tank and embarks on a highway trip. The amount of gas left in the tank, \(G\text{,}\) in gallons, is a function of the number of miles \(m\) driven, \(G=g(m)\text{.}\) Use the graph of \(g(m)\) given below to answer the following questions.
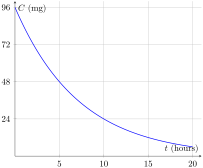
The amount of caffeine remaining in the body, \(C\text{,}\) in milligrams, \(t\) hours after drinking a cup of coffee, \(C=C(t)\) is given by the graph below.
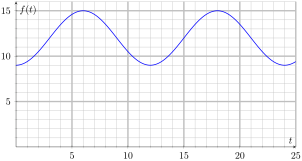
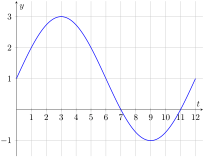
For the function \(y=f(t)\) whose graph is depicted below, identify the intervals on the \(t\)-axis for which the function is increasing and for which the function is decreasing.
Increasing on the intervals \((0,3) \cup (9,12)\text{.}\)Or, write as \(0\lt t\lt 3\) and \(9\lt t\lt 12\). Decreasing on the interval \((3,9)\text{.}\)Or, write as \(3\lt t \lt 9\).
Create a table of values and sketch the graph of the function \(y=x^3\) for \(-2\leq x\leq 2\text{.}\) Then use your calculator or any other graphing utility to check your graph.
The total cost of a meal in a restaurant, \(C\text{,}\) in dollars, as a function of the price of the meal, \(p\text{,}\) in dollars is given by:
\begin{equation*}
C=p+0.20p
\end{equation*}
where the term \(0.20p\) corresponds to the \(20\%\) tip. Create a table of values and sketch the graph of the function \(C=p+0.20p\) for \(10\leq p\leq 20\text{.}\) Then use your calculator or any other graphing utility to check your graph.
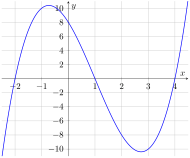
This is looking for ordered pairs \((x,y)\) on the graph of the function where \(y=0\text{,}\) which are: \((-2,0)\text{,}\)\((1,0)\text{,}\) and \((4,0)\) (the points in green).
This is looking for ordered pairs \((x,y)\) on the graph of the function where \(y=8\text{,}\) which are (approximately): \((-2.2,8)\text{,}\)\((2,8)\text{,}\) and \((3.4, 8)\) (the points in blue).
The amount of caffeine remaining in the body, \(C\text{,}\) in milligrams, \(t\) hours after drinking a cup of coffee, \(C=C(t)\) is given by the graph below:
For the function \(y=f(t)\) whose graph is depicted below, identify intervals on the \(t\)-axis on which the function is increasing and the intervals on the \(t\)-axis on which the function is decreasing.
The function is increasing on the intervals \((0,3)\) and \((9,12)\text{,}\) which in inequality notation reads \(0\lt t \lt 3\) and \(9 \lt t \lt 12\text{,}\) respectively. The function is decreasing on the interval \((3,9)\text{,}\) which in inequality notation reads \(3 \lt t \lt 9\text{.}\)