Applied Precalculus MTH 103

Section 3.1 Introduction to Quadratic Functions

Consider the function \(f(x)=x^2+2x-3\text{.}\) A table of values for this function is provided below.
\(x\) \(y = f(x)\) point
\(\textcolor{blue}{-4}\) \((-4)^2 + 2(-4) - 3 =\) \(\textcolor{red}{5}\) \((-4, 5)\)
\(\textcolor{blue}{-3}\) \((-3)^2 + 2(-3) - 3 =\) \(\textcolor{red}{0}\) \((-3, 0)\)
\(\textcolor{blue}{-2}\) \((-2)^2 + 2(-2) - 3 =\) \(\textcolor{red}{-3}\) \((-2, -3)\)
\(\textcolor{blue}{-1}\) \((-1)^2 + 2(-1) - 3 =\) \(\textcolor{red}{-4}\) \((-1, -4)\)
\(\textcolor{blue}{0}\) \(0^2 + 2(0) - 3 =\) \(\textcolor{red}{-3}\) \((0, -3)\)
\(\textcolor{blue}{1}\) \(1^2 + 2(1) - 3 =\) \(\textcolor{red}{0}\) \((1, 0)\)
\(\textcolor{blue}{2}\) \(2^2 + 2(2) - 3 =\) \(\textcolor{red}{5}\) \((2, 5)\)
We can use this table of values to construct the plot of \(f(x)=x^2+2x-3\) or we can rely on a graphing utility. In either case, the result is the β€œU”-shaped graph in FigureΒ 3.1.1. In the figure below, change the values of \(a,b,c\) to see how the function changes.

Instructions.

Drag the slider to change the curve.
Figure 3.1.1.
From the graph, we can see that \(f(x)=x^2+2x-3\) has two \(x\)-intercepts, \(x=-3\) and \(x=1\text{,}\) located at the points \((-3,0)\) and \((1,0)\text{,}\) respectively. The \(y\)-intercept \(y=-3\) is located at \((0,-3)\text{.}\) Furthermore, there is an additional special point on this graph at which it β€œturns around” that is referred to as its vertex. The vertex is located at \((-1,-4)\text{.}\)
The function \(f(x)=x^2+2x-3\) is an illustration of a quadratic function.

Definition 3.1.2. Standard Form for a Quadratic Function.

A function that can be written in the form
\begin{equation*} f(x)=ax^2+bx+c \end{equation*}
where \(a\text{,}\) \(b\text{,}\) and \(c\) are real numbers with \(a\neq0\) is called a quadratic function.
The form \(f(x)=ax^2+bx+c\) is referred to as the standard form for a quadratic function.

Subsection Graphs of Quadratic Functions

The graph of a quadratic function is β€œU”-shaped and called a parabola. To be precise, we will often call it a quadratic parabola to distinguish it from parabola-like graphs of other functions.

By the way...

Example 3.1.3.

Use the graph of each quadratic function to identify its intercept(s) and vertex.
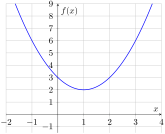
  1. \(\displaystyle f(x)=x^2-2x+3\)
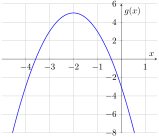
  2. \(\displaystyle g(x)=-2x^2-8x-3\)
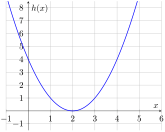
  3. \(\displaystyle h(x)=x^2-4x+4\)
Solution.
The graph of each quadratic function can be obtained by making a table of values or by using a graphing calculator or utility.
  1. A short description.
    The \(y\)-intercept is where the graph crosses the \(y\)-axis; this occurs at \(y=3\text{.}\) There are no \(x\)-intercepts, since the graph is located entirely above the \(x\)-axis. The β€œturning point” or vertex is the lowest point on the graph since this is an upward facing quadratic parabola; hence the vertex is \((1,2)\text{.}\)
  2. A short description.
    The \(y\)-intercept of this quadratic function is \(y=-3\text{.}\) The graph crosses the \(x\)-axis at two points so there are two \(x\)-intercepts. Visual inspection reveals that the approximate values of \(x\) at which the \(x\)-intercepts are located are \(x=-3.6\) and \(x=-0.4\text{.}\) The vertex is the highest point on the graph since this is a downward facing quadratic parabola; hence the vertex is \((-2,5)\text{.}\)
  3. A short description.
    The \(y\)-intercept of this function is \(y=4\text{.}\) The graph crosses the \(x\)-axis at one point only: \((2,0)\text{.}\) Hence, \(h(x)\) has one horizontal intercept \(x=2\text{.}\) The vertex is the lowest point on the graph since this is an upward facing quadratic parabola; hence the vertex is \((2,0)\text{.}\)
ExampleΒ 3.1.3 indicates that a quadratic function \(f(x)=ax^2+bx+c\) may have two horizontal intercepts, one horizontal intercept, or no horizontal intercepts. Recall that horizontal intercepts of \(f(x)\) are also called the real zeros of \(f(x)\) since they are values of \(x\) where \(f(x)=0\text{.}\) With this in mind, our observation about the number of horizontal intercepts a quadratic function may have can be used to conclude that the quadratic equation \(ax^2+bx+c=0\) may have two real solutions, one real solution, or no real solution.
The three parts of ExampleΒ 3.1.3 illustrate several other features of quadratic functions. Observe that the parabolas obtained by graphing \(f(x)=x^2-2x+3\) and \(h(x)=x^2-4x+4\) opened up while the parabola obtained by graphing \(g(x)=-2x^2-8x-3\) opened down. Whether the parabola associated with a quadratic function \(f(x)=ax^2+bx+c\) will open up or open down is determined entirely by the sign of the leading coefficient \(a\text{.}\) Additionally, it can be seen that each of the quadratic parabolas obtained from graphing the functions listed in ExampleΒ 3.1.3 is symmetric about the vertical line passing through its vertex.

Example 3.1.5.

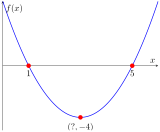
Below is the graph of a quadratic function \(f(x)=ax^2+bx+c\text{.}\) The horizontal intercepts and the \(y\)-coordinate of the vertex are given. Find the \(x\)-coordinate of the vertex and the vertex itself.
A short description.
Solution.
The \(x\)-coordinate of the vertex is the midpoint between the horizontal intercepts \(x_1=1\) and \(x_2=5\text{.}\) Visually, we may be able to β€œguess” that the midpoint is \(x=3\text{.}\) To ensure precision, we can use the formula for the midpoint of the \(x\)-intercepts:
\begin{equation*} \frac{x_1+x_2}{2} = \frac{1+5}{2} = 3. \end{equation*}
Hence the \(x\)-coordinate of the vertex is indeed \(3\text{.}\) As the \(y\)-coordinate of the vertex is given, the vertex is the ordered pair \((3,-4)\text{.}\)

Example 3.1.6.

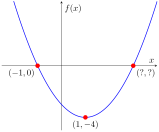
Below is the graph of a quadratic function \(f(x)=ax^2+bx+c\text{.}\) One of the two horizontal intercepts and the vertex are given. Find the point on the \(x\)-axis that corresponds to the other horizontal intercept of \(f(x)\text{.}\)
A short description.
Solution.
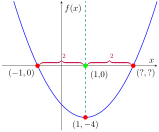
The graph of every quadratic parabola is symmetric with respect to the vertical line passing through its vertex. In this case, we can see that the vertical line through the vertex \((1,-4)\) crosses the \(x\)-axis at the point \((1,0)\text{.}\)
A short description.
By symmetry, each \(x\)-intercept must be the same horizontal distance from the point \((1,0)\text{.}\) As \((-1,0)\) is a horizontal distance of \(2\) units from \((1,0)\text{,}\) the second horizontal intercept must be \((3,0)\text{.}\)
Alternatively, we could use the fact that the \(x\)-coordinate of the vertex, \(x=1\text{,}\) is the midpoint between the given horizontal intercept \(x_1=-1\) and the second horizontal intercept \(x_2\) that we are tasked with finding. Using the formula for the \(x\)-coordinate of the vertex:
\begin{align*} x\text{--coordinate of the vertex}\amp=\frac{x_1+x_2}{2}\\ 1\amp=\frac{-1+x_2}{2}\\ 2\cdot 1\amp=\frac{-1+x_2}{\cancel{2}}\cdot \cancel{2}\\ 2\amp=-1+x_2\\ 2 \textcolor{blue}{+1}\amp=-1+x_2\textcolor{blue}{+1}\\ 3 \amp= x_2 \end{align*}
Whether we use a visual approach or the formula, we arrive at the same conclusion: the second horizontal intercept is at the point \((3,0)\text{.}\)

Subsection Quadratic Functions and Their Graphs in Applications

Quadratic functions often model real-life scenarios for which the intercepts and vertex have important practical interpretations.

Example 3.1.7.

A chair manufacturer finds that the number of chairs that it can sell depends on the price \(p\) (in dollars) that it charges per chair. Specifically, the number of chairs that will be sold if \(p\) dollars is charged per chair is given by the formula \(1200-6p\text{.}\)
  1. Find the formula for the revenue function \(R(p)\) and graph \(R(p)\text{.}\)
  2. For what price(s) per chair is the manufacturer’s revenue \(\$0\text{?}\)
  3. What is the maximum revenue? What price should the chair manufacturer charge per chair in order to maximize revenue?
Solution.
  1. The revenue \(R(p)\) is the income that the chair manufacturer makes from selling chairs. This means that
    \begin{align*} R(p) \amp = \bigg(\textcolor{blue}{\underbrace{\genfrac{}{}{0pt}{}{\text{ \color{black}price charged}}{\text{\color{black}per chair}}}_{p}}\bigg) \times \bigg(\textcolor{red}{\underbrace{\genfrac{}{}{0pt}{}{\text{ \color{black}number of chairs sold}}{\text{\color{black}at that price point}}}_{1200-6p}}\bigg)\\ \amp = p(1200 - 6p) \end{align*}
    Note that the revenue function is in fact a quadratic function, which can be seen more easily by using the distributive law to rewrite the formula we found above in the standard form \(R(p)=ap^2+bp+c\text{:}\)
    \begin{align*} R(p) \amp = p(1200-6) \\ \amp = 1200p - 6p^2 \\ \amp= -6p^2 + 1200p. \end{align*}
    ToDo: Figure out the tikzmark commands
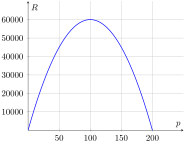
    Here, \(a=-6\text{,}\) \(b=1200\text{,}\) and \(c=0\text{.}\) The graph of the revenue function can be obtained using a table of values or a graphing utility and the result is the parabola below.
    A short description.
  2. The price(s) for which the chair manufacturer’s revenue will be \(\$0\) can be found by setting the revenue function equal to 0 and solving for \(p\text{:}\)
    \begin{equation*} p(1200 - 6p) = 0. \end{equation*}
    The only way that a product of two factors can be 0 is if one of the factors itself is 0, so the above breaks into the two equations:
    \begin{equation*} p = 0 \quad \text{and} \quad 1200-6p=0 . \end{equation*}
    Solving the latter,
    \begin{align*} 1200 - 6p \amp \;=\; 0\\ 1200\textcolor{blue}{-1200} - 6p \amp \;=\; 0\textcolor{blue}{-1200}\\ \frac{-6p}{-6} \amp \;=\; \frac{-1200}{-6}\\ p \amp \;=\; 200. \end{align*}
    These two values can also be found by visually inspecting the graph of \(R(p)\text{.}\) The revenue is \(\$0\) where the graph crosses the horizontal axis, which occurs at the values of \(p=0\) and \(p=200\text{.}\)
    Hence if either \(\$0\) or \(\$200\) is charged per chair, the revenue will be \(\$0\text{.}\) In the first case, if the chair manufacturer charges nothing for a product, it will of course receive no income. In the second case, charging \(\$200\) per chair results in the chair manufacturer pricing itself out of the market; they have set the price too high for customers to be willing to purchase the item.
  3. Since the graph of \(R(p)\) is a parabola that opens down, answering questions about the maximum revenue involves the vertex. We can find the vertex by visual inspection or by using the midpoint of the two horizontal intercepts \(p_1=0\) and \(p_2=200\text{.}\) The formula
    \begin{equation*} \frac{p_1+p_2}{2}=\frac{0+200}{2}=100 \end{equation*}
    tells us that the \(p\)-value of the vertex is 100. The \(R\)-value of the vertex can be found by substituting \(p=100\) into the formula \(R(p)=-6p^2+1200p\text{:}\)
    \begin{equation*} R(100)=-6(100)^2+1200(100)=60000. \end{equation*}
    Since the vertex is \((100,60000)\text{,}\) the maximum revenue occurs when a price of \(\$100\) is charged per chair. The maximum revenue is \(\$60,000\text{.}\)

Exercises Exercises

Standard Form.

Write each quadratic function in standard form. Then determine whether its graph will open up or open down without graphing the function.

Intercepts and Vertex.

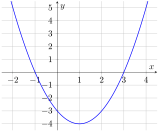
Use the graph of each quadratic function to identify its intercept(s) and vertex.
5.
A short description.
Solution.
horizontal intercepts: \(-1\text{,}\) \(3\text{;}\) vertical intercept: \(-3\text{;}\) vertex: \((1,-4)\)

Horizontal Intercepts.

The horizontal intercepts of a quadratic parabola are given. Find the \(x\)-coordinate of its vertex.

9.

A quadratic parabola crosses the \(x\)-axis at the point \((2,0)\) and has its vertex at the point \((4,4)\text{.}\) Find the second point on the \(x\)-axis where the parabola crosses the \(x\)-axis. Does the parabola open up or open down?
Solution.
\((6,0)\text{;}\) opens down

10.

A lighting company can sell \(1000-2p\) units of its specialty chandelier if it charges \(\$p\) per specialty chandelier.
  1. Find the formula for the revenue \(R(p)\) generated from specialty chandelier sales and graph it.
  2. At what price will the lighting company sell zero of its specialty chandelier?
  3. What is the maximum revenue? What price should the lighting company charge per specialty chandelier in order to maximize revenue?
Solution.
  1. \(R(p)=p(1000-2p)\) or \(R(p)=-2p^2+1000p\)
  2. \(\displaystyle \$500\)
  3. The maximum revenue is \(\$125,000\text{.}\) The lighting company should charge \(\$250\) per specialty chandelier to maximize revenue.